34%
peak cut
Three portfolios, three starting points, one thing in common: every figure below is reconciled to the utility invoice.





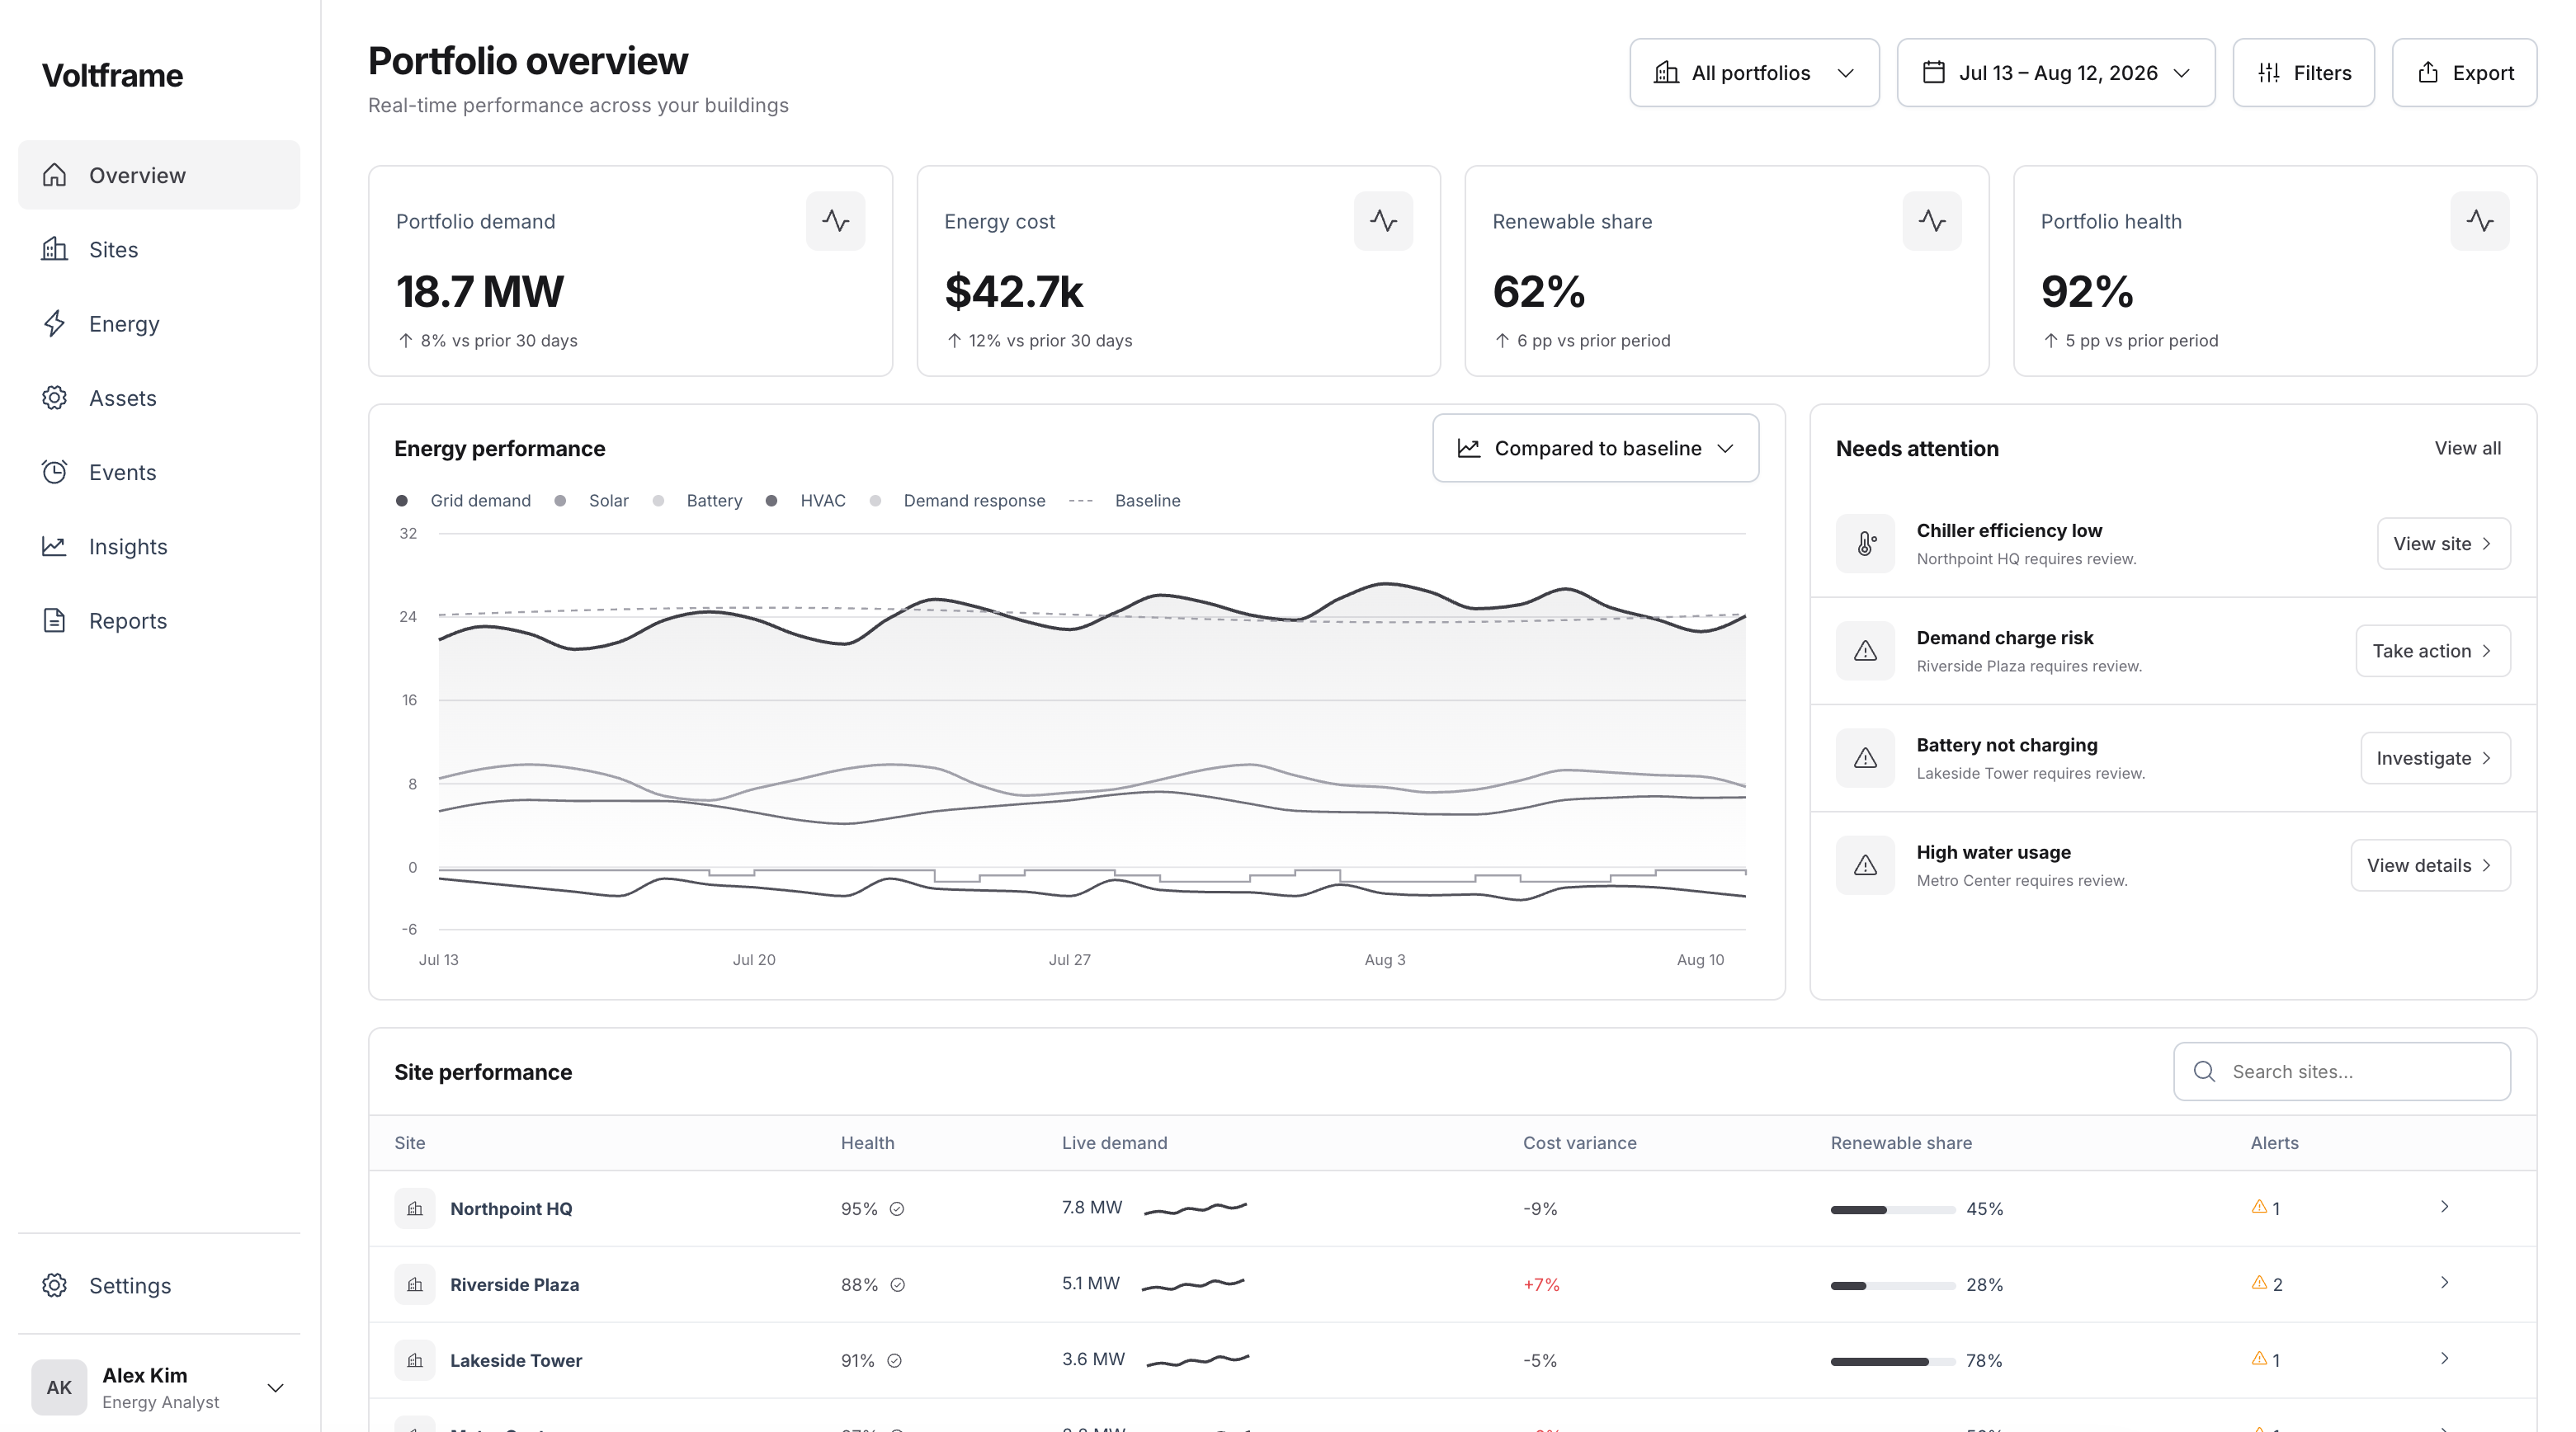
HVAC pre-cooling plus a storage peak-shift schedule moved the daily peak off the utility’s ratchet window.
"We stopped arguing with the vendor’s baseline. The number matches our invoice now."
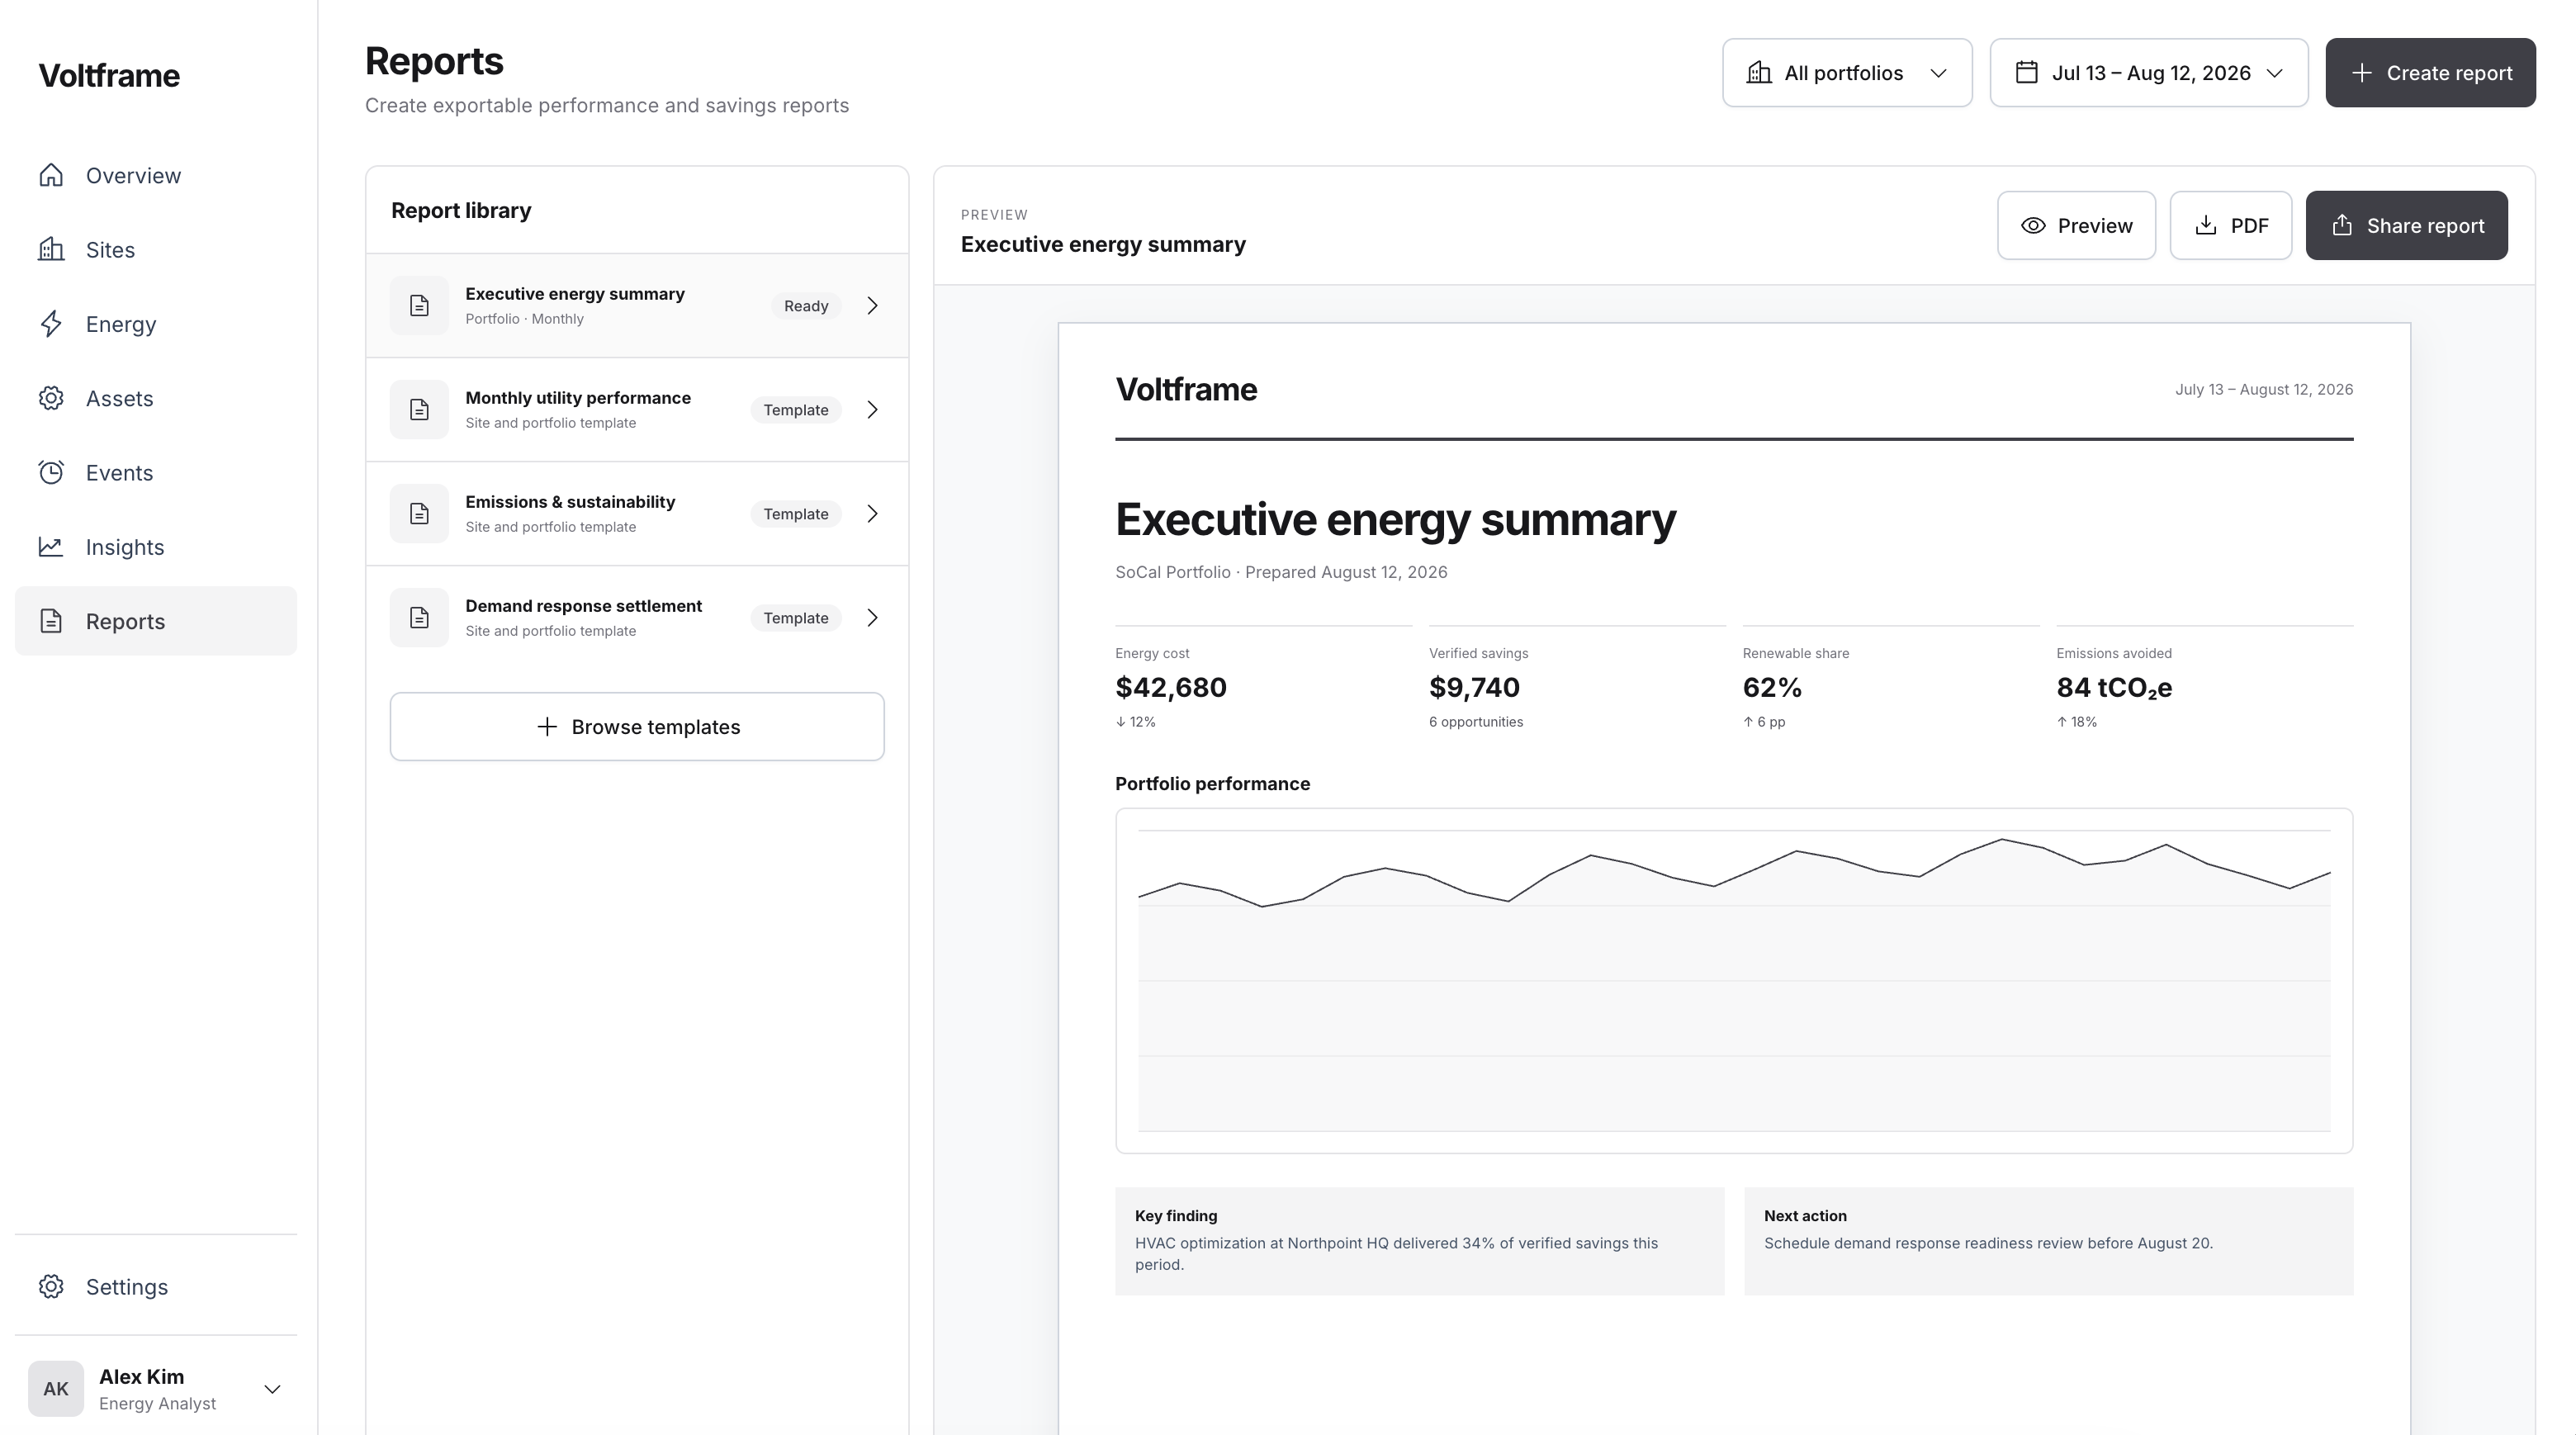
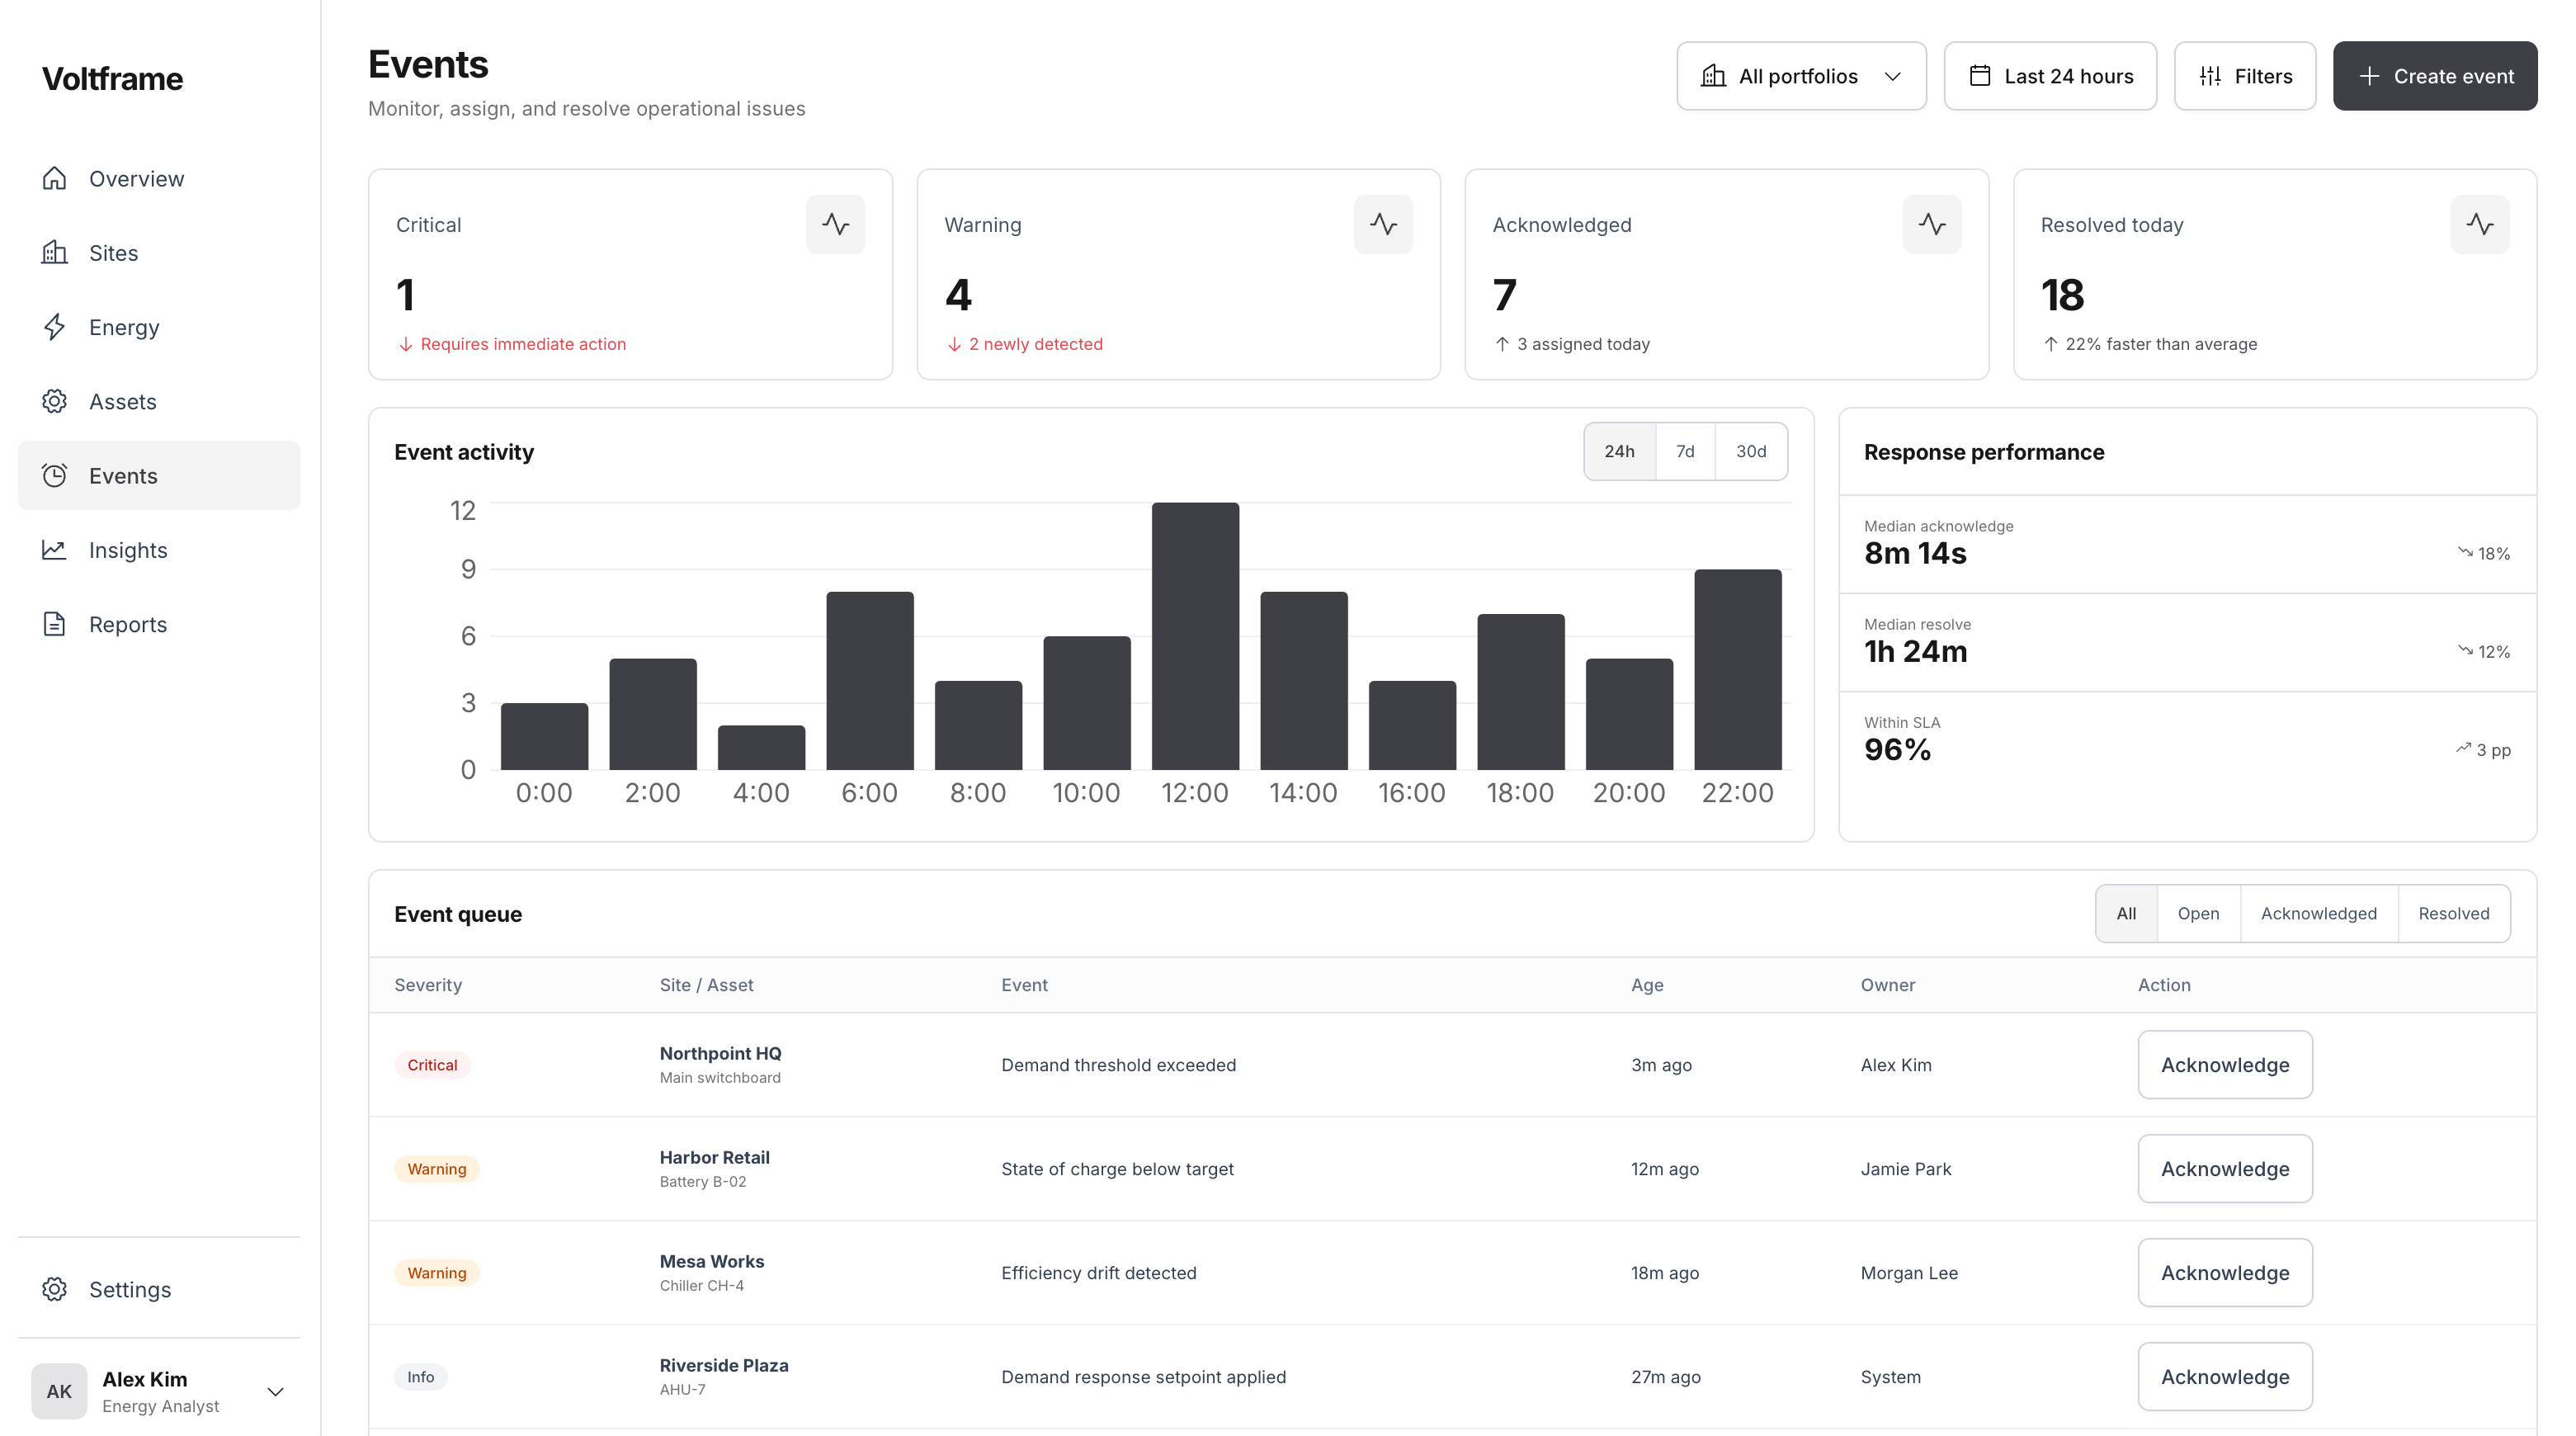
Live event handling let the team commit to DR windows knowing the measured response before the utility settled.
"Events used to be guesswork. Now we see the forecast peak and the response in one place."
Scoped gateway hardware brought a pneumatic system online; software did the rest and paid for the hardware in under a year.
"They told us weeks, not days, up front. That honesty is why we signed."
Open the demo with sample data, or ask for numbers scoped to your buildings.