31%
avg. peak demand reduction
Grid, solar, storage, HVAC load and demand response, reconciled to the bill — so the peak you act on is the peak finance pays for.
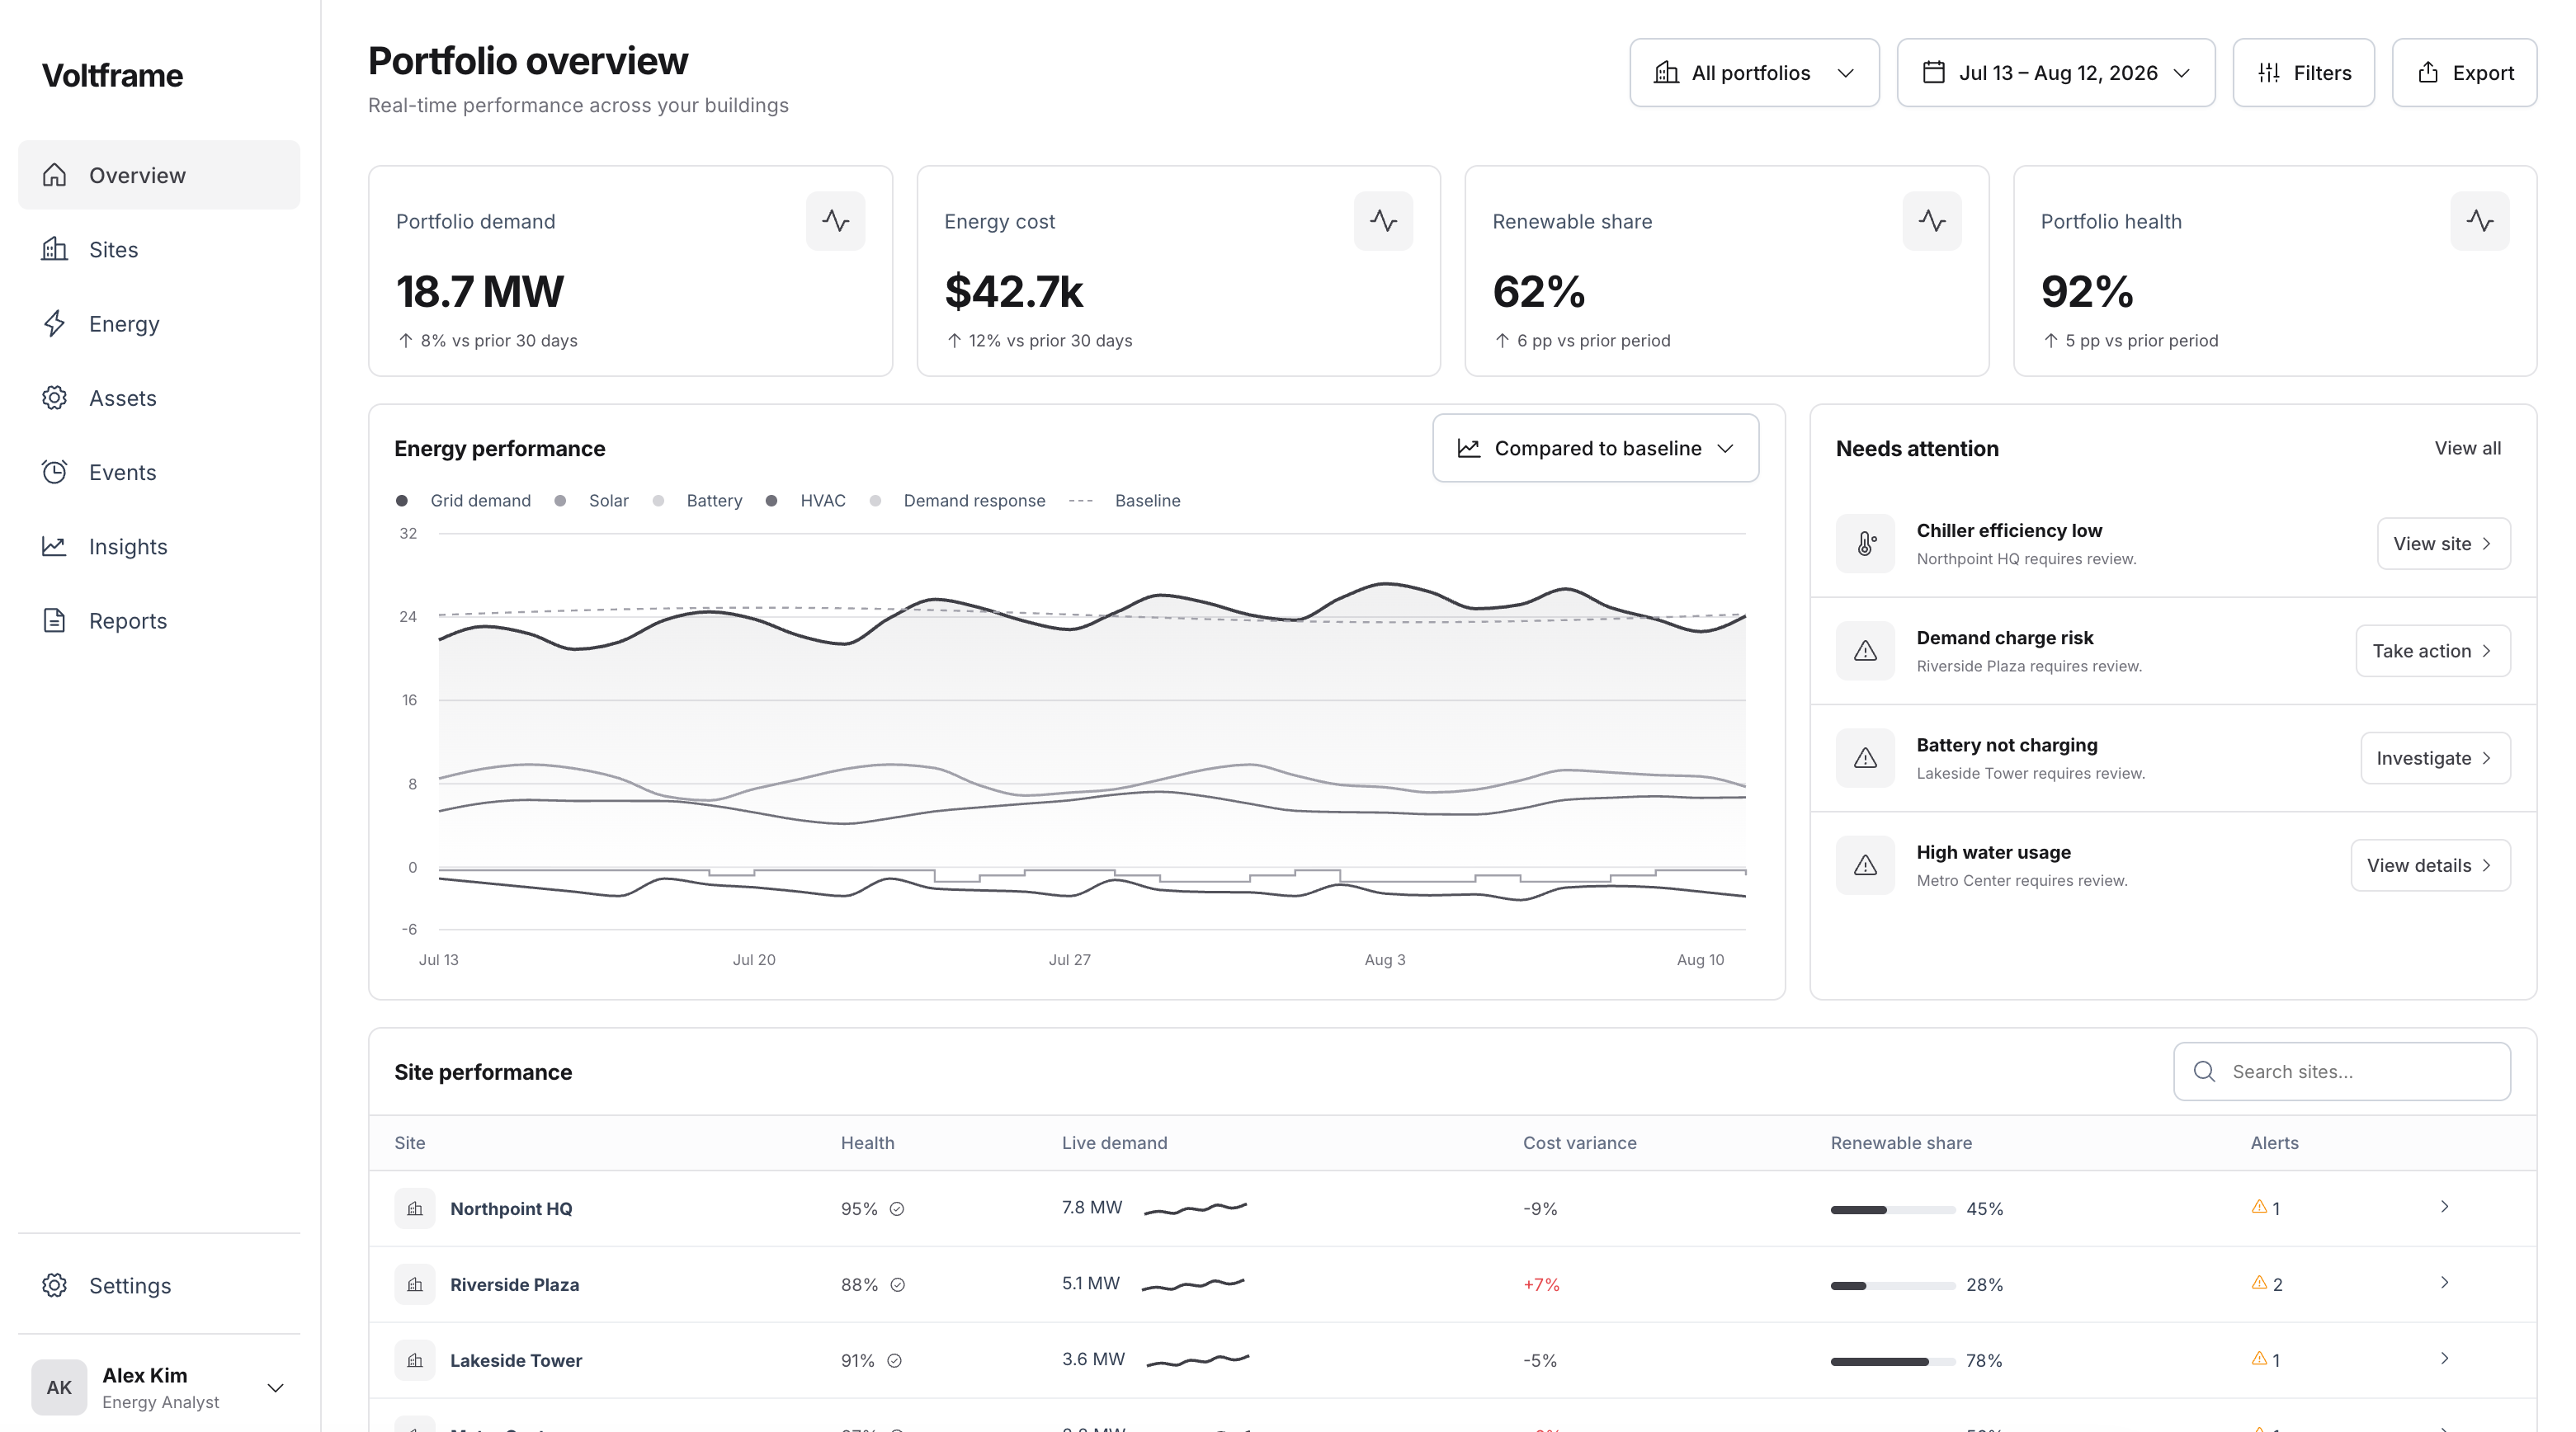





Most tools stop at grid, solar and storage. Voltframe also reads HVAC load and utility demand response — the two sources that actually move your peak.
Interval data from utility meters and submeters, reconciled against the bill.
On-site generation, inverter-level, net of curtailment.
State of charge, dispatch windows and cycle cost.
Runtime and load from the building management system.
Utility event signals, forecast peaks and measured response.
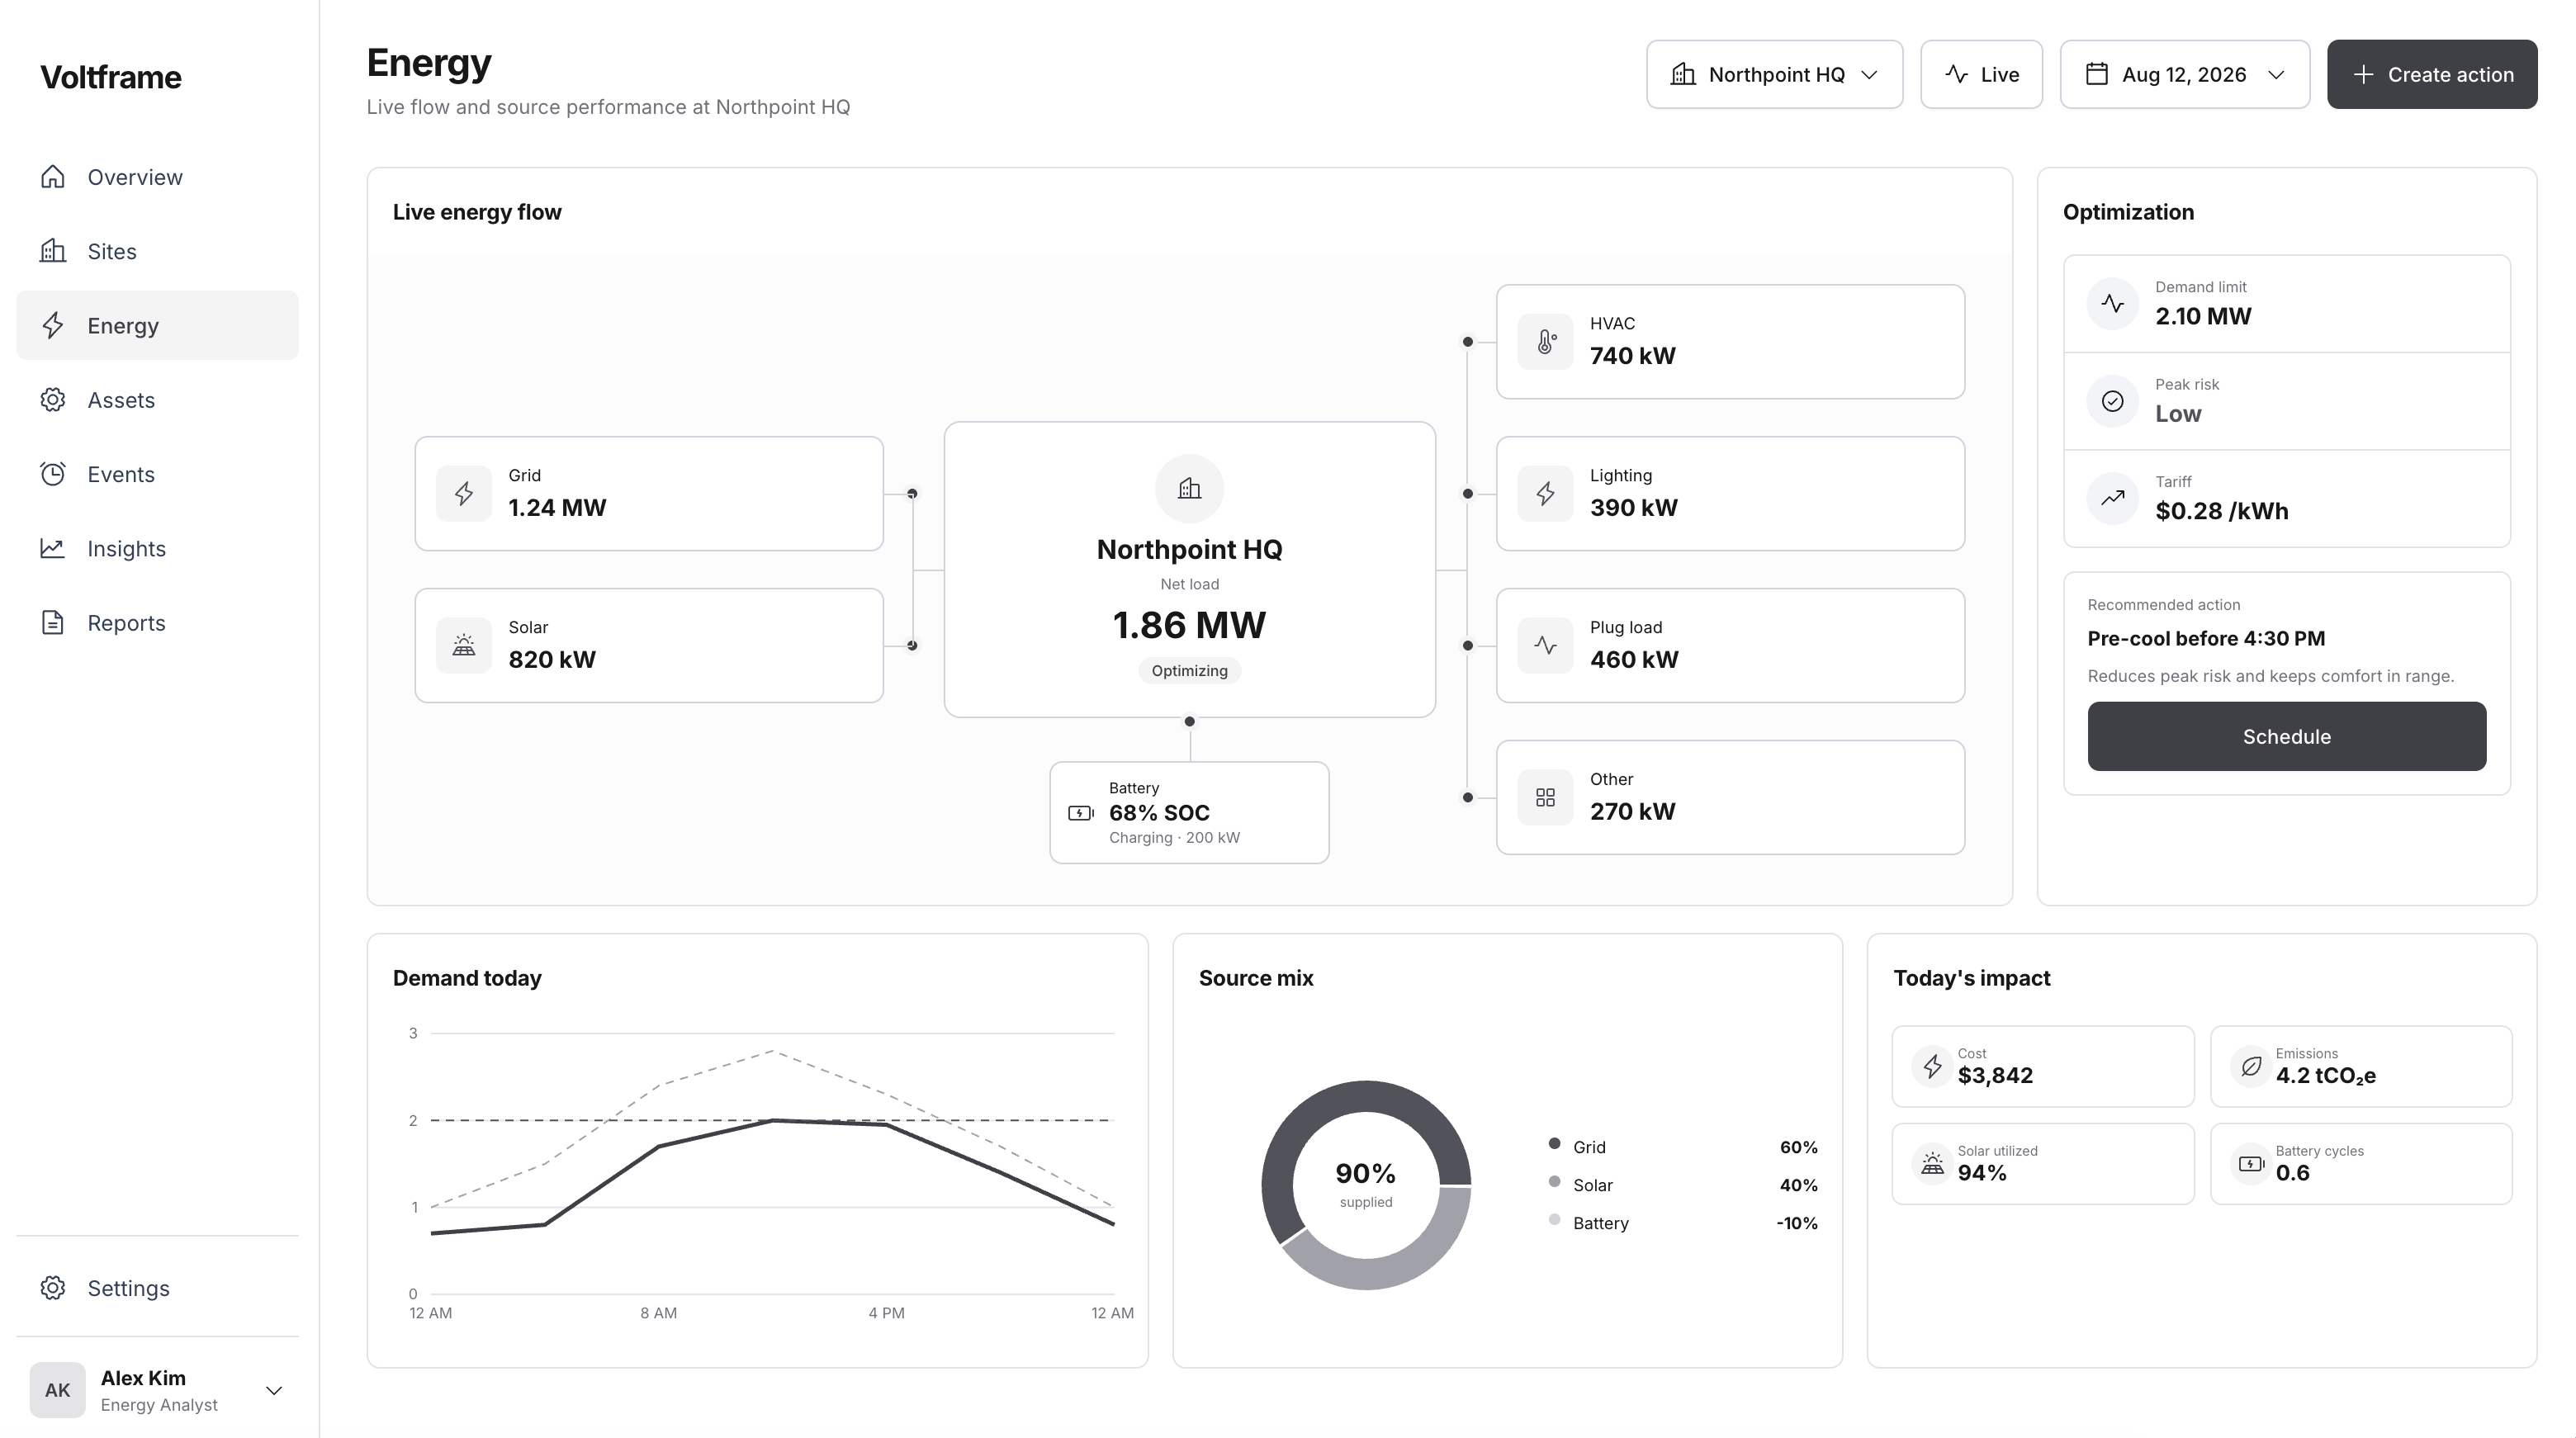

A modern BACnet building connects in days. A 1980s pneumatic system needs hardware, and we scope that separately. Typical onboarding runs 6–10 weeks, most of it on your side.
Five live sources wired into one feed — utility, BMS, inverters.
Meter data reconciled to the invoice before any claim is made.
The peak shaved to your demand limit, verified after the fact.
Onboarding runs 6–10 weeks, most of it on your side. The guided demo shows the full product before any call.